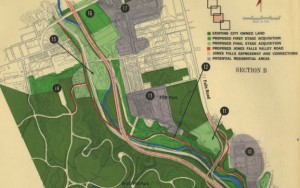
 Every large city, in looking to make decisions regarding building, zoning, transportation, park facilities, and economic renewal areas, spends a lot of time and money in developing plans for the possible future. The anticipated future sometimes does not happen the way it is foreseen: changes in financing (and general economic conditions), urban needs, population distribution, and political climate may modify or scrap the best plans created by the brightest planning people. These once-distant plans, seen from our perspective, show a Baltimore City of nearly a million residents (in 1960) planning for a future of grand economy, gleaming high-speed transportation, and beautiful public areas for recreation. Our scans of Baltimore development plans are housed in JScholarship, the JHU digital repository found from the Sheridan Libraries’ home page.
The GIS and Data Center, located on A Level of MSE, has scanned (so far) images of nine Baltimore City development plans, from several different Baltimore agencies, dated from the late 1950s to the mid-1980s. The plans cover diverse aspects of Baltimore life: Charles Center and business urban renewal, high-speed public transit, highways (even those never started), Baltimore Harbor, and the Jones Falls Valley.
Baltimore has a history of plans for public and personal transportation systems, for instance; some of these have come to some fruition in the form of our light rail (providing service from downtown to the Northeast areas of Reisterstown and Owings Mills), a subway that runs from the businesses of Harborplace to the hospitals that lie eastward, and various plans for highway access through Baltimore City (I-70 was planned to run alongside US Route 40, connecting to I-95, but Interstate 83’s completion to downtown has been a success).
Why have some plans been tabled, and others backed by the City completed? Data sets are one way to organize and analyze organize statistical trends of population changes, income, municipal and Federal funding, crime statistics, and business data, over time, in various overlays, in order to graphically see trends that might not be obvious otherwise, or to provide a powerful illustration to information contained in a paper.
With the help of GIS mapping programs, we can show you how statistical datasets, downloaded and modified, chosen for a particular time and a place, can be overlaid on these maps, and others from Baltimore City, to visually tell a story; in this instance, a story of a large city’s view of the future, and the planning and execution of that vision.
There’s a way to do this, and the Sheridan Libraries’ GIS and Data Center can show you how! Email us at GISandData@jhu.edu for questions about GIS and data sets.
To investigate our online resources, these, visit our Lib Guides for data guidance, and for help with GIS and maps.
Note: we are always on the lookout for other planning maps for Baltimore City or County; if you know of other agencies that have produced planning books with images, or you know where one can be procured, please let us know! Contact Jim Gillispie at 410-516-4816, or jeg@jhu.edu.
