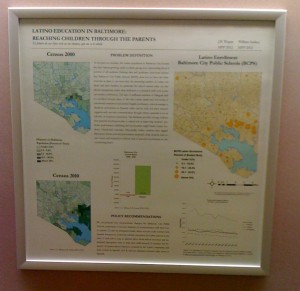
GIS is mapping software that is used to create maps from a wide variety of data. Who at Hopkins is using GIS and how? The GIS and Data Services Unit in the Eisenhower Library has created a space to display finished maps that students, researchers, and faculty have produced. Where can you see them? Visit A Level in Eisenhower Library; the maps are on the long wall that leads into the GIS and Data Services Unit.
The opening display features maps created by students in the Institute for Policy Studies and the Bloomberg School of Public Health’s Center for Liveable Future. Visit the display and see how GIS can be used to formulate policy, illustrate election turnout, and map food deserts in Baltimore City. The maps show what people have done and hopefully, will inspire others to use GIS in their course work or research.
If you have created a map that you would like to have up on the GIS Display Wall, contact Bonni Wittstadt. For more information about the software visit the GIS and Maps guide.
